
|
 02-10-11, 07:42 PM
|
#21 |
|
Lex Parsimoniae

Join Date: Feb 2009
Location: Woburn, MA
Posts: 4,918
Thanks: 114
Thanked 250 Times in 230 Posts
|
The most telling thing is the fact it's an 11 year cycle..
You look at this, and you wonder how 11 years got stretched out to nearly 14..?. IMHO, the up-turn should have started a long time before 2009. Half of 11 years is 5.5 years..  Notice in the past, it's about 5.5 years from peak to valley.. Not 8 or 9 years.  It's 15F now, and I see Zero F in the forecast.. Gotta go set some timers, so the oil burner can take over for the Sanyo tonight..  |

|

|
|
02-11-11, 12:42 PM
|
#22 | |
|
Journeyman EcoRenovator
Join Date: Feb 2010
Location: Arab, AL
Posts: 491
Thanks: 109
Thanked 49 Times in 43 Posts
|
Quote:
 |
|
|
|
|
|
02-11-11, 12:49 PM
|
#23 |
|
Lex Parsimoniae
Join Date: Feb 2009
Location: Woburn, MA
Posts: 4,918
Thanks: 114
Thanked 250 Times in 230 Posts
|
Regardless of the exact numbers, we know from history, less solar output (during sun spot minimums) means colder weather..
This delayed solar cycle means that global warming might be put on hold for a while. If normal sun spots never come back, the delay could be indefinite.. ") |
|
|
|
|
02-11-11, 01:20 PM
|
#24 | |
|
Master EcoRenovator
Join Date: Dec 2008
Location: Vancouver Island BC
Posts: 745
Thanks: 23
Thanked 37 Times in 30 Posts
|
Quote:
Post Carbon - 2010 hottest climate year on record, NASA says Everyone get's smacked by these larger and worse storms and sees 5 feet of snow and declares warming bull**** but the climate change prediction models suggest we should expect bigger and more extreme storms and swings in temperatures. |
|
|
|
|
|
02-11-11, 03:08 PM
|
#25 |
|
Lex Parsimoniae
Join Date: Feb 2009
Location: Woburn, MA
Posts: 4,918
Thanks: 114
Thanked 250 Times in 230 Posts
|
Did you see the comments on that link?
Actually, NASA's records have had to be "corrected" several times after making similar claims about record setting temps. they have always been revised downward. Real scientists have used ice core readings over many centuries that show the planet was warmer during several epochs (including the one where Norsemen colonized Greenland when it was green a thousand years ago and then froze to death when the earth cooled once more) than the worst-case scenarios imagined by the warmist alarmists. Don't forget, NASA is controlled by politicians, and many politicians love the whole idea of global warming. It's the kind of thing that allows them to have more power. Allows them to tax-n-spent insanely. And that's what they live for. Everyone knows that a lot of the 'scientist' that are making a good living off global warming studies have been manipulating or omitting data, in order to enrich themselfs. I'm not a religious or superstitious person, (I don't take things on faith) so I'm a little suspicious when someone tells me the world is going to end, unless they can have 25 percent more of everyone's paycheck. It just sounds like another scam.. |
|
|
|
|
02-12-11, 10:44 AM
|
#26 |
|
Journeyman EcoRenovator

Join Date: May 2009
Location: Buffalo, NY
Posts: 344
Thanks: 3
Thanked 17 Times in 15 Posts
|
Why do so many conspiracy theories revolve around NASA?
Gorgeous weather we're having. I wasn't expecting snow overnight, but we got about three inches of powder, which I swept off the driveway in ten minutes with my "pusher" shovel. It's a very welcome change of pace from last week's wet, heavy stuff. They're calling for a melt this week. Xringer, it's time to shovel some snow back on to your driveway to melt, so when it dumps another foot at the beginning of March, you have room for it. |
|
|
|
|
02-12-11, 01:44 PM
|
#27 |
|
Lex Parsimoniae
Join Date: Feb 2009
Location: Woburn, MA
Posts: 4,918
Thanks: 114
Thanked 250 Times in 230 Posts
|
Looking at the forecast, I'm not so sure that it's going to add up to a lot of melting..
(Snow being white and all). I think the cooler winters are going to be a short term thing. Once the sun gets back to it's old self, things will mellow out and winters will not be so cold. Like the 90s were..  Looking at the current rate of over-all increase (0.06°C/decade), this isn't something that can be easily distinguished from the normal weather cycles that have been going on for thousands of years.. The Current Wisdom: The Short-Term Climate Trend Is Not Your Friend | Cato @ Liberty  I wonder if that blue line was caused by the quite sun  Or, maybe the average is dropping because so many sensors are covered in snow & ice?? |
|
|
|
|
02-12-11, 08:22 PM
|
#28 |
|
Journeyman EcoRenovator

Join Date: Dec 2009
Location: Maynard, MA Eaarth
Posts: 383
Thanks: 78
Thanked 39 Times in 32 Posts
|
FYI, the Cato Institute is funded largely by oil money.
|
|
|
|
|
02-12-11, 08:34 PM
|
#29 | |
|
Lex Parsimoniae
Join Date: Feb 2009
Location: Woburn, MA
Posts: 4,918
Thanks: 114
Thanked 250 Times in 230 Posts
|
Quote:
Yeah, and Patrick J. Michaels is a funny looking guy too! Patrick J. Michaels | Cato Institute: Policy Scholars |
|
|
|
|
|
02-12-11, 09:14 PM
|
#30 | ||
|
Journeyman EcoRenovator
Join Date: May 2009
Location: Buffalo, NY
Posts: 344
Thanks: 3
Thanked 17 Times in 15 Posts
|
Quote:
Quote:
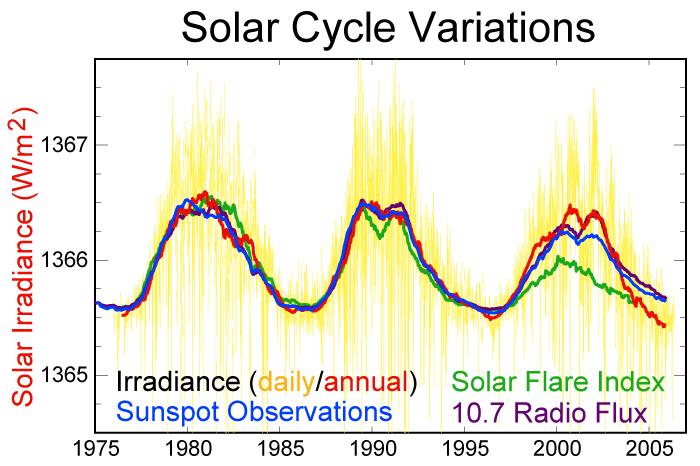 Sunspots or not, total irradiance is down, which would surely have a cooling effect. |
||
|
|
|
 |
|
|


 Linear Mode

