View Single Post
Old 11-10-09, 06:04 PM   #19
Daox
Administrator
 
Daox's Avatar
 
Join Date: Aug 2008
Location: Germantown, WI
Posts: 5,525
Thanks: 1,162
Thanked 374 Times in 305 Posts
Default

That is a great idea and I thought I did haha. Here it is.

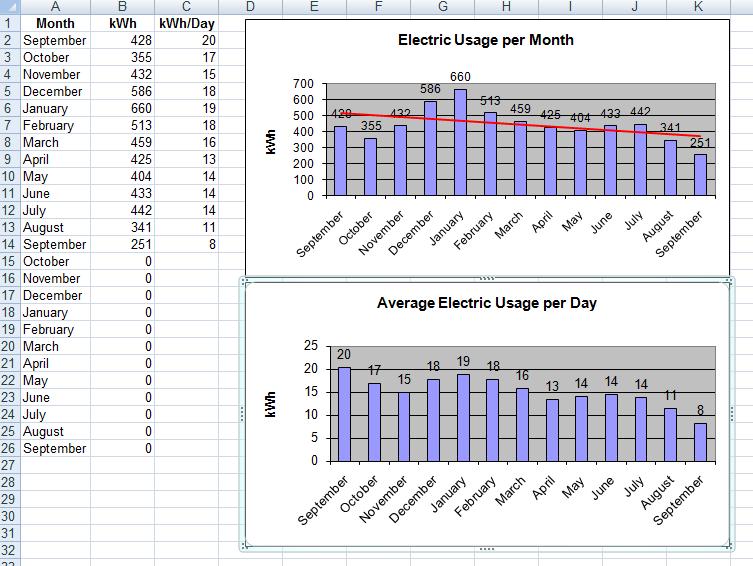
Since posting, I've added some additional and nice features to the spreadsheet. I now graph the electric usage, gas usage, and the total (combined) usage in kWh.

I would like to incorperate the heating degree days and cooling degree days into the chart somehow too to show that X month was significantly hotter or cooler than Y month. Just haven't gotten that far yet.

Ideas are quite welcome.

Attached Images
 
Attached Files
File Type: xls EnergyTracking.xls (54.5 KB, 936 views)
__________________
Current project -
To view links or images in signatures your post count must be 0 or greater. You currently have 0 posts.


To view links or images in signatures your post count must be 0 or greater. You currently have 0 posts.
&
To view links or images in signatures your post count must be 0 or greater. You currently have 0 posts.
Daox is offline   Reply With Quote