My electric utility has a data logger that gives graphs and data for daily electrical consumption and the average temperature for that interval.
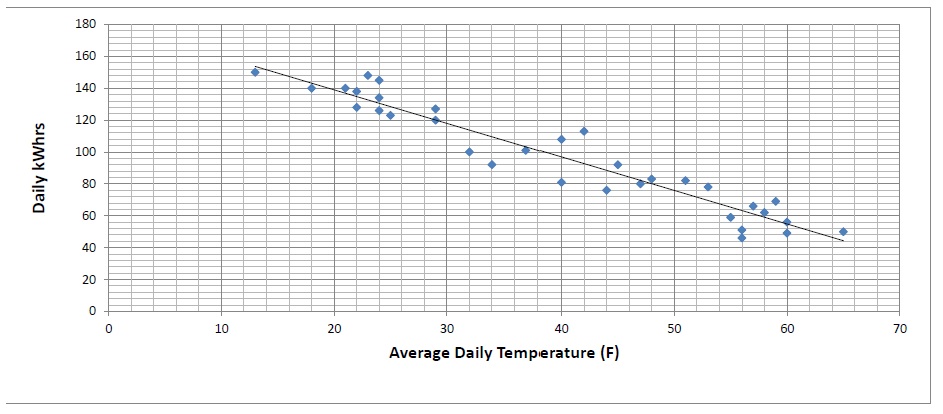
I grabbed about two months of data and plotted average temp vs. kWhrs for each day. I have geothermal heat pumps in both houses and I expect that the colder it gets the more consumption
Not surprisingly, the above is true, but I was surprised at how linear the relationship was. To be truthful, I have used this analysis for other companies and homes and it works when you have a meter you can interrogate (or look at) on a consistent basis (natural gas meter for example).
For this, I looked up our local winter degree days and average winter temp. From that, I can find from the graph, the average daily kWhr consumption and the statistical length of winter.
By observing where the electrical consumption is at 65 F, I can account for basal use. Subtracting total from basal use, I can see just how much just heating costs.
Mind you, I must appear rather extravagant to many uses here, but this accounts for two homes, barn office, pumps for water (livestock) and heaters to keep livestock waterers from freezing.
Now I post and see if converting the Excel spreadsheet to a PDF and loading that helps. Thanks Daox!
Steve