randen--I will be doing a bunch of tests to learn about energy use vs heat into water, but first I want to show some data I generated to get my own PT chart.
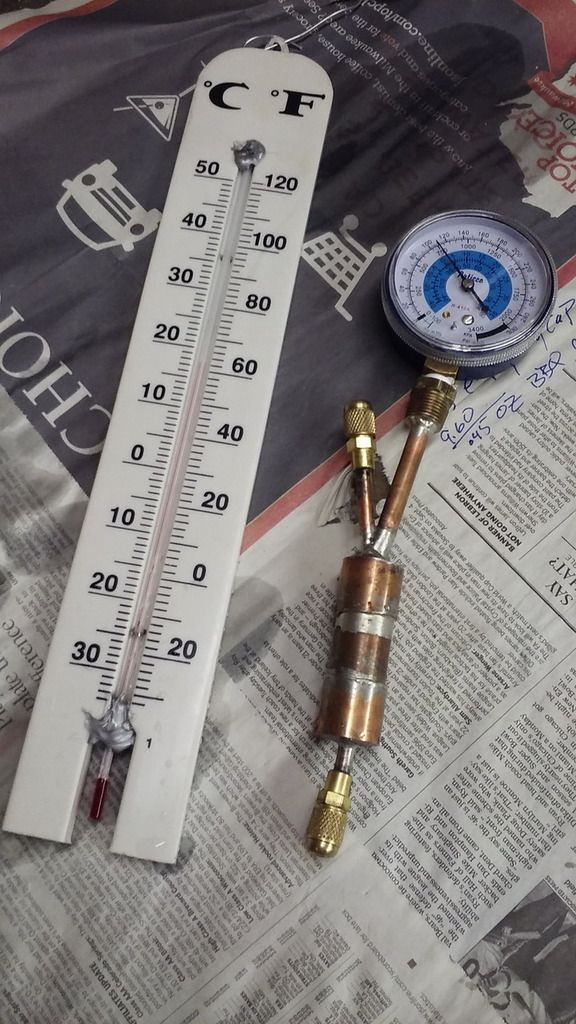
I made a test chamber from 3/4 copper tube and caps with pressure gauge per this photo.
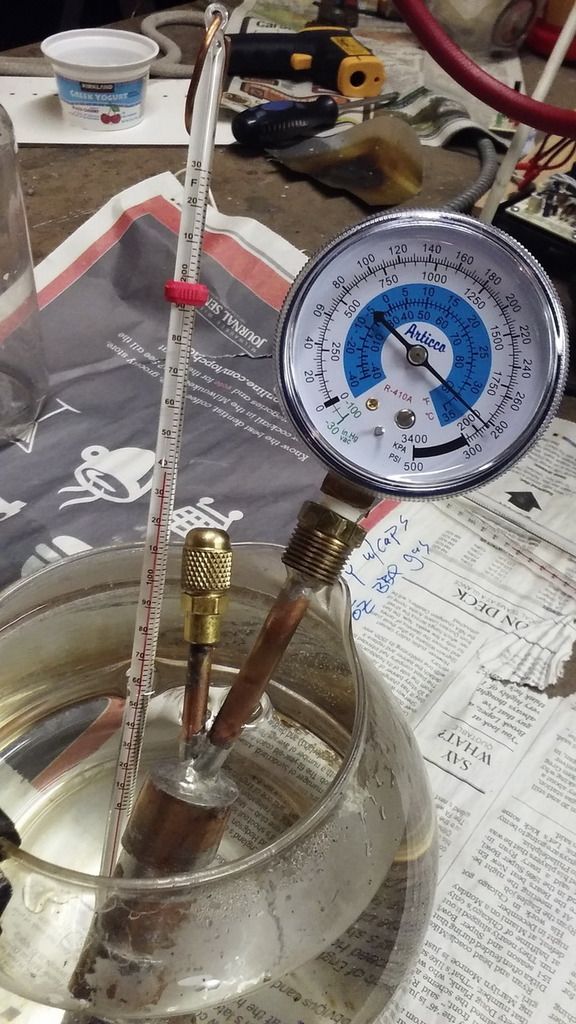
I added some of my BBQ gas to the test chamber and submerged it in hot water. I took temp and pressure readings and added amounts of cold water to lower the temp and repeated the measurements. See photo.
I also looked up the pressure of R290 from a published chart. All data entered into spreadsheet table and charted.
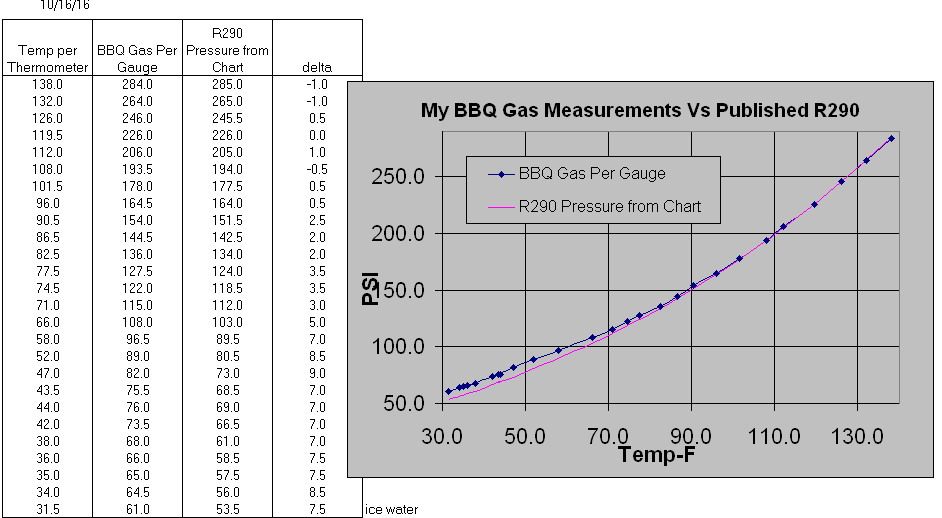
Neither thermometer or pressure gauge are calibrated so you should be skeptical of these results. But it it interesting that my measurements aligned so closely with published data at high temps and diverged as the temp dropped and always in fairly smooth curve. If you zoom in you will see it's not a perfectly smooth curve.
It may seem like a redundant exercise, but I have been getting some SH of -3F that seem wrong so this tends to explain that. I also want to try some propane butane blends and being able to create a PT chart for an unknown blend interests me.